As mentioned on numerous occasions, if nothing else, if investors only understand and appreciate the following, they will always be on the right side of the market and will never be influenced by others’ opinions or news headlines:
- Investors must understand the role of the U.S. central bank (the Fed). The U.S. Federal Reserve System was created in 1913 to perform all roles monetary, but one of their key statutory (written in law) mandates is to “To maintain orderly economic growth and price stability.” This agency has more and better information on the economy than anyone in the world. It was not created to promote hyperinflation or to create depressions. The Fed’s key mandate must be clearly understood and appreciated.
- The stock market is a leading economic indicator. The economy does not lead the stock market. Hence, once these two points are clearly understood and remembered, the market’s logic becomes apparent. Hence, when the economy slows and heads into a recession, the Fed will ease and will keep easing until the economy responds (remember, that’s their mandate). The stock market, being a leading economic indicator, will have bottomed 6-9 months before the recovery begins, not after. For example, "the market" bottomed in October, 2008 and the recession ended at the end of June, 2009 and a [market] recovery commenced, eight months ahead of the [economic] recovery. Conversely, when the economy overheats; inflation surges; and speculation is rampant, the Fed will tighten by draining liquidity from the system and raise interest rates in an attempt to cool the economy. The stock market, being a leading economic indicator, will head south long before the onset of a slowdown or recession, not after. This chain of logic is so simple that anyone with an IQ slightly above room temperature would understand it. Yet, most on Wall Street with umpteen degrees and decades of experience can’t figure it out.
IDENTIFYING A MAJOR MARKET BOTTOM
- The economy is in bad shape; jobs are hard to find; and headlines are black. Capacity utilization plunges. Talk of depression is widespread. The talking heads will declare “this time is different. They (the Fed) has lost control.”
- Investors are crying the blues as their portfolios are showing huge losses. Worldwide, investors panic and a sense of despair and hopelessness prevails. Brokers are sleeping like babies; theywake up every hour and cry.
- The Fed eases by injecting liquidity into the system and lowers the Discount rate three or more times in succession and will keep easing until the economy responds.
- The Classic Yield Curve (13-week T-bill Yield vs. 30-year T-bond Yield) starts to steepen (short rates below the long rates).
- The interest-sensitive sectors such financials, bonds, preferred shares, utilities bottom and start to head North while the major market averages continue to head south. Mesmerized by the decline in the market indices, investors are unaware that a “rolling” bottom has begun.
- As the Fed eases further, the growth and consumer discretionary issues bottom while the major market averages move yet to new lows.
- The market becomes grossly undervalued.
- Investors are sitting on a mountain of cash and hold little equities. They have no appetite for stocks.
- A selling climax occurs as investors panic. Seized by fear, investors “throw the baby out with the bathwater” as they can’t bear the loss anymore and are convinced the world will end. An emotional catharsis occurs and stocks move from weak hands into strong hands.
The bear market ends and a bull market begins.
IDENTIFYING A MAJOR MARKET TOP
- The economy is booming; workers are hard to find; and headlines are glowing. Capacity utilization is running full tilt.
- Investors are euphoric and the stock market becomes topic du jour at cocktail and dinner parties. Waiters, taxi drivers, bartenders, and shoeshine boys are giving clients hot tips; they think they are market mavens. Everyone is a genius and have the keys to Fort Knox.
- Euphoria reins. Investors are heavily invested in equities and hold little cash.
- Stock brokers, confusing their own genius with a bull market, buy Ferraris and Lamborghinis and dine in uber expensive restaurants.
- The economy overheats, inflation surges; and speculation is rampant. Consequently, in their attempt to cool the economy, the Fed tightens meaningfully by draining liquidity from the system and raises interest rates numerous times.
- The market becomes grossly overvalued.
- After a long period of flattening, the Classic Yield Curve is inverted (short rates higher than long rates). Then, as the economy deteriorates, the yield curve starts to steepen (short rates start to move below the long rates).
- Interest–sensitive sectors such as financials, bonds, preferred shares, utilities along with consumer discretionary, start to head south. Meanwhile, dragged up by the late-cycle issues, the major market averages keep moving to new highs. Investors are lulled by the new highs in the market indices, not realizing the broad market is already heading into a bear market. Not surprisingly, the various Advance-Decline Lines start to head south 3-6 months before the major market averages. New Highs start to contract and New Lows expand.
- Finally, the major market averages top and join the rank and file by heading in a southeasterly direction.
The call for this week: We are on the West Coast seeing accounts, speaking at conferences, and doing gigs for our financial advisors and their clients. If past is prelude the markets will do something in our absence. Unsurprisingly, last week we received no less than 30 emails about the ten Hindenburg Omens that have been registered over the past two weeks (read: telegraphing a stock market crash). That indictor, however, is being triggered by the selling of interest-rate-sensitive ETFs and closed-end bond funds. Meanwhile, as we wrote last Friday:
“[Next] week we could see more powerful upside energy, but at this point it’s not looking all that powerful either. It’s more likely we’ll see more energy come into the market as we get closer to the [mid] November energy peak.”
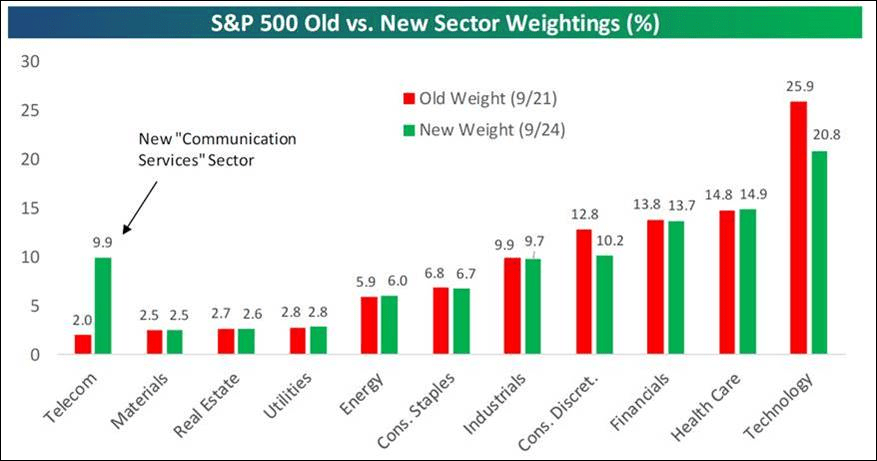
Quite frankly, given the low energy mix stocks typically “drift,” which is exactly what happened last week as we suggested. It may be more of the same this week, but should develop into something more powerful to the upside over the next few weeks. As a sidebar, the recent changes in S&P sector weightings are worth mentioning. Of particular note is that Telecommunication has gone from a 1.98% weight to a 9.9% weight (see chart below).
Yesterday, the equity markets caught an unexpected tailwind, although we have repeatedly said Canada was going to “blink” on NAFTA, and we think China will do the same. Evidently, the equity markets expect the same, but yet the equity markets could not hold on to yesterday’s gains into the closing bell. That is consistent with our upside “drift” call. Of our unpublicized letter yesterday, which is being published today, a day late, we stand by this strategy and embrace our upside trading target of 2980 – 3000 despite “calls” of this is JUST a range-bound stock market . . . GOOD GRIEF!
Chart 1
No comments:
Post a Comment